Summary: Sahysmod is a mathematical
(numerical) computer program (model) for
simulation and prediction of the salinity of
soil moisture, ground and drainage water,
the flow of groundwater, depth of the water
table and the drain discharge in irrigated
agricultural lands under various geohydrologic
conditions, varying water management options,
including the re-use of ground water for
irrigation by pumping from wells (conjunctive
use), and several crop rotation schedules.
The aquifer may be unconfined (phreatic) or
semi confined leaky). The spatial variation is
accounted for by a nodal network of polygons.
|
General: Sahysmod combines the
agro-hydro-soil-salinity model SaltMod and an
adjusted/extended polygonal groundwater
(ground water) model SGMP of my colleague
Dr.J.Boonstra. It allows for the introduction of
unconfined (phreatic) and semiconfined
(semi-confined, leaky) aquifers.
The modelling (modeling) helps in determining
sustainable land use and environmentally sound
watermanagement (water management) for
sustainability.
When the maximum number of polygons (300) is used,
the data base becomes quite large. The latest
version has improved network-making functions and a
version with more than 300 polygons can be made
available on request.
|
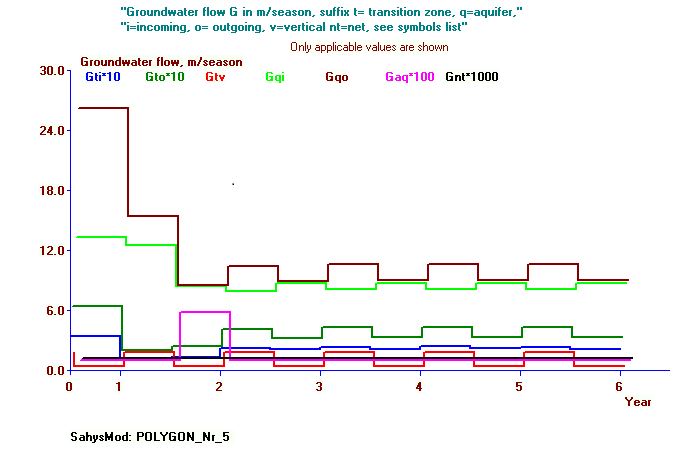
Details: The model calculates waterbalances
(water balances, budgets), actual from potential
evaporation (evapotranspiration), capillary rise,
deep percolation, and groundwater (ground water)
flow.
Optionally, farmers' responses can be simulated
adjusting agriculture and irrigation to
waterlogging (water logging) and salinity.
During May 2005, Mr. Juan Manuel Mendía and
Mr. Javier Sassi, Comahue University, Rio Negro,
Argentina, have made considerable efforts to test
the input menu. As a result it was adjusted in
many instances. I would like to express my
gratitude to both gentlemen.
;
In September 2006 I visited the university of Bonn
(Germany) where the model is used for assessment
of watermanagement (water management) in a valley
in Marocco
(reference).
As a result the model was further improved and
extended to accommodate particular situations.
In November 2008 the guided
procedure for construction of the polygonal
network was improved thanks to the efforts of Mr.
Tsegay Fithanegest Desta who applied the model in
NE Thailand
(reference) .
Again, the procedure was extended as a result of
comments by Mrs. Francesca Verones from
Switzerland.
On 20 September 2011 the program was given the
facility to bring the rotation type under the
farmers' responses, which resulted in version
1.3.3
On 24 September 2011 the general input interface,
in some cases, was given a multiple choice box
instead of an edit box.
On 3 July 2012 SahysMod
was totally brought under Delphi so that the
auxiliary Fortran files are no longer required
and the size of the package was considerably
reduced. This is version 2.1.1.
On 25 Novenber 2012 also the option was given
to paste polygonal coordinates from the
clipboard.
|
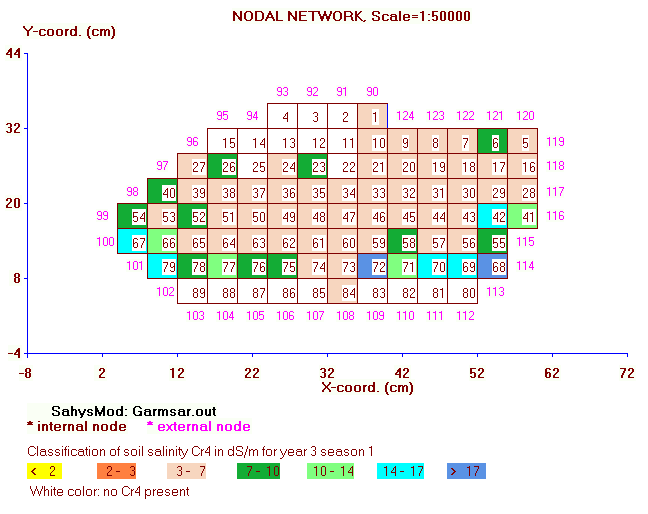
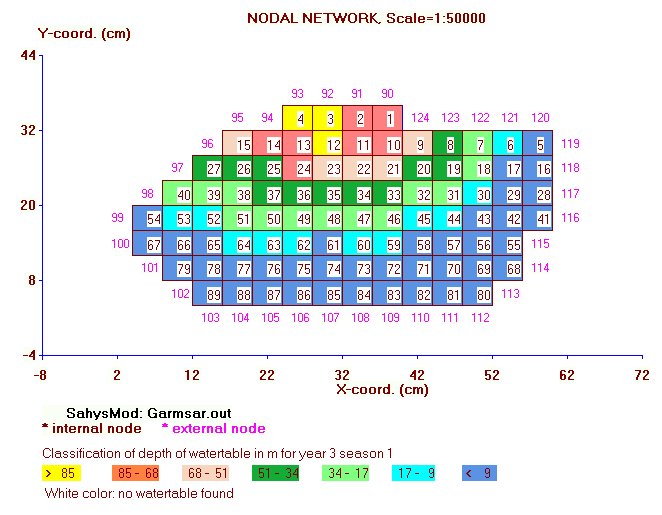
Mapping: The program provides graphs.
For mapping options see the hint below or the
facilties text.
Also, the option is given to produce *.prn
text files of input and output features which
can be used in GIS, CAD, and other contour
(isoline) mapping programs.
A free and simple program for this purpose is,
for example, QuikGrid (yes, not QuickGrid).
For a guide and examples of mapping with
QuikGrid see
Mapping Guide or,
with more detail,
Case
studies .
|
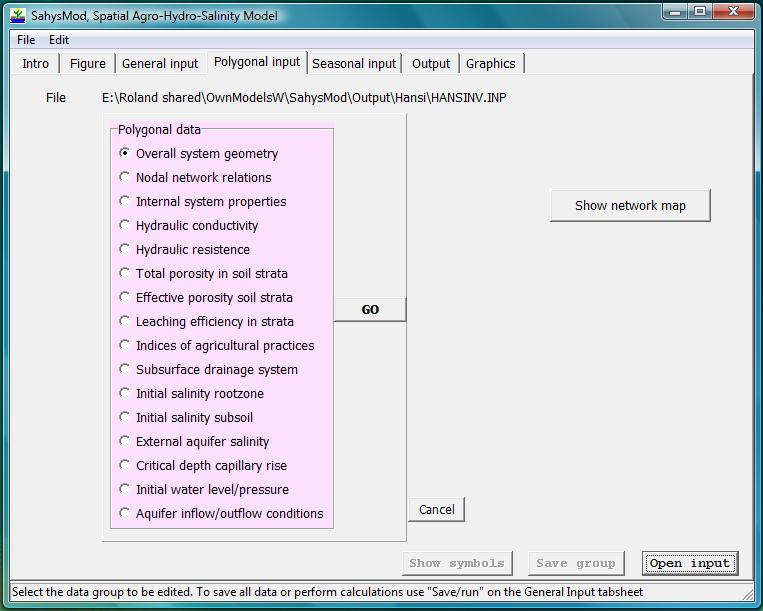
Start: The program starts clicking on
Sahysmod.Exe. More information is given in
the program itself.
|
Experiences:
For improvement, I am interested to learn about
your experiences with SahysMod. For this, there
is a contact form.
|
Update:
Thanks to suggestions made by Sue Guo, on 15
January 2018, SahysMod was given additional
facilities for annual calculations whereby the
annual input files are automatically created and
opened.
|
HINT:
Since November 2017 the model includes mapping
options (see examples below).
This version also contains a larger number of
crop rotation options.
|
|
Download
SahysMod
Return to:
Software
& models
General articles
& manuals
Artículos
(in Spanish,
en Español)
Published
reports & cases
Particular
reports & cases
FAQ's
& answers
Home
page
|