Summary: The CumFreq model program calculates
the
cumulative (no exceedance, non-exceedance) frequency
and it does probability distribution fitting of data
series, e.g. crop production, soil properties,
salinity, depth to watertable (water-table),
rainfall, river and drain discharge, groundwater
(ground-water) and river level, hydraulic
conductivity and soil permeability for water.
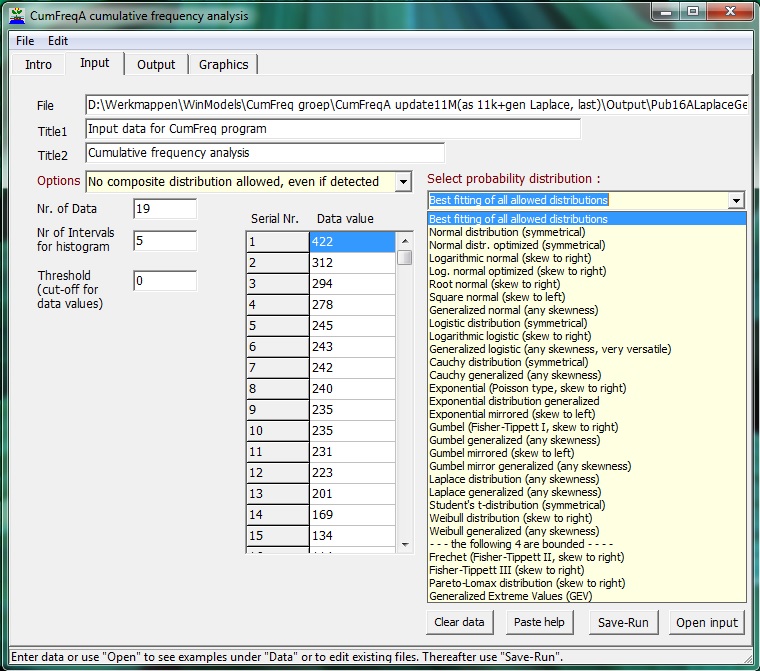
The computer program fits various linear,
logarithmic, exponential and double exponential
cumulative frequency distributions, including the
normal, log-normal (lognormal), (log)logistic,
Cauchy, Pareto, Weibull, Frechet (Fisher-Tippett
type II), Kumaraswamy, Gumbel, GEV, Erlang (Gamma),
Burr, Dagum, Laplace, Student, Gompertz,
exponential, Poisson and Rayleigh probability
distributions, and selects the most appropriate
distribution using the method of best fit.
Some of the distributions are useful for extreme
value analysis.
Preference for a specific distribution can also be
expressed.
The Cumfreq calculator model not only uses
logarithmic but also exponential transformations
of the data. The exponent (greater than 0) is
optimized automatically. These so called
generalized distributions have great
flexibility, but they are mostly not used in
other distribution fitting calculators, except
the Burr distribution which is a generalization
of Pareto.
Further, the Cumfreq application (app) uses
mirrored (inverese, complementary) distributions
that reverse the skewness, so that the number of
distributions that are possibly applicable is
enlarged. One of the few
existing examples is the inverse (mirrored,
complementary) characteristic of the Burr and
Dagum distributions.
The Cumfreq program calculator allows negative data.
In case of distributions that do not support
negative data, the distribution is shifted in
positive direction so that they are made
applicable.
The download and use of the CumFreq model program is
totally free. It is freeware.
|
Details:
When the mathematical model program detects a
discontnuous probability function, it gives the
user the choice to introduce a breakpoint
(break-point) or threshold value, yielding a
segmented or composite frequency and probability
distribution.
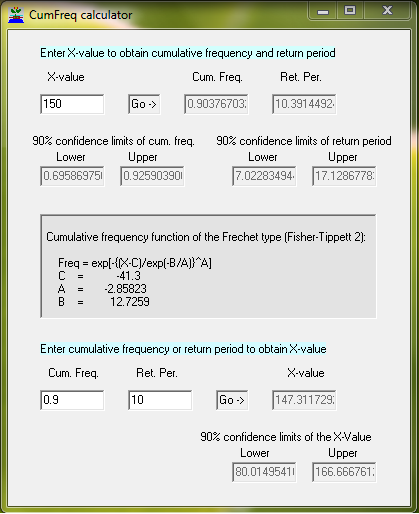
The resulting probability distribution is
accompanied by 90% confidence limits and belts
(bands) and return periods (recurrence
intervals).
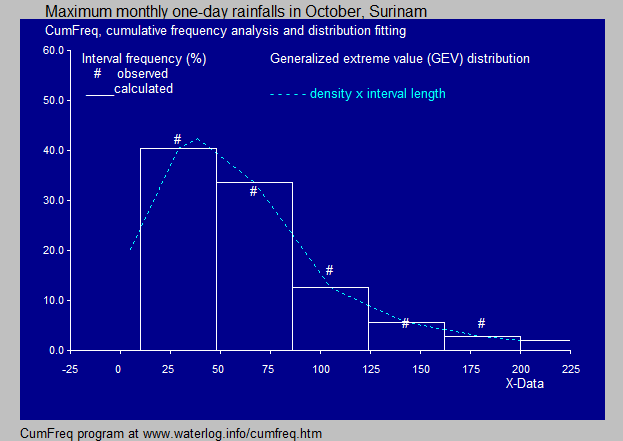
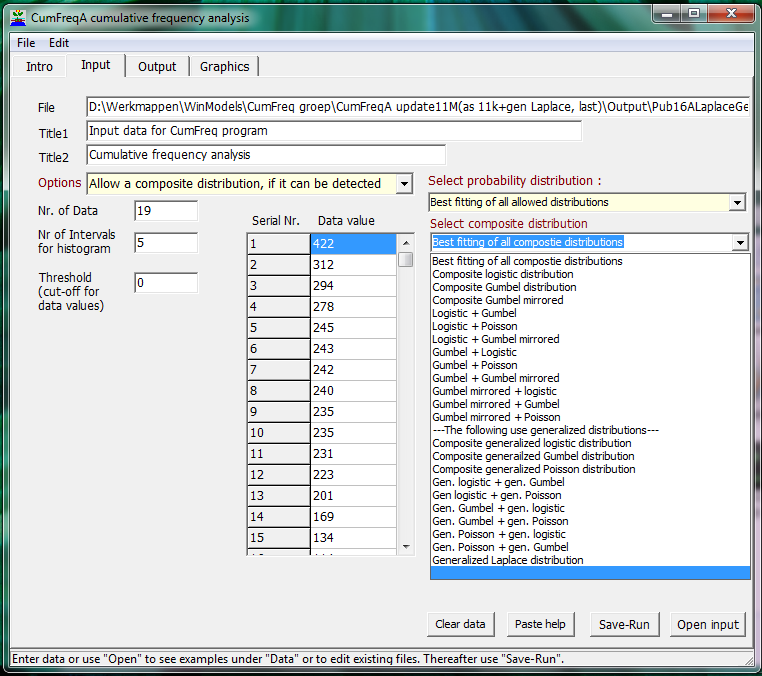
The program also divides the range of data into a
number of equal intervals and calculates an
interval frequency distribution or histogram.
The number of intervals is to be given by the
user.
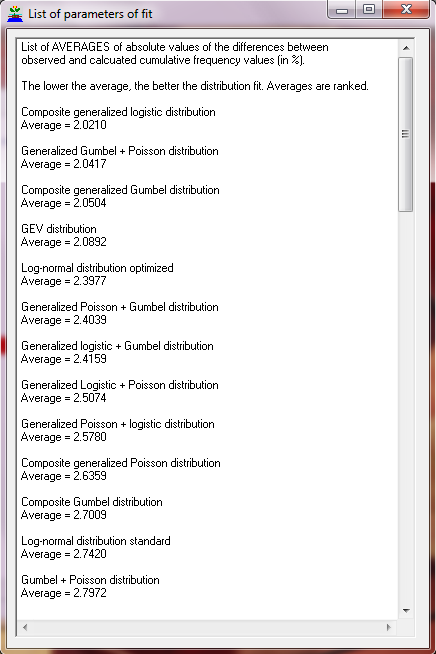
On 22 March 2018 the option to see a list of
distributions ranked according to their goodness
of fit was introduced.
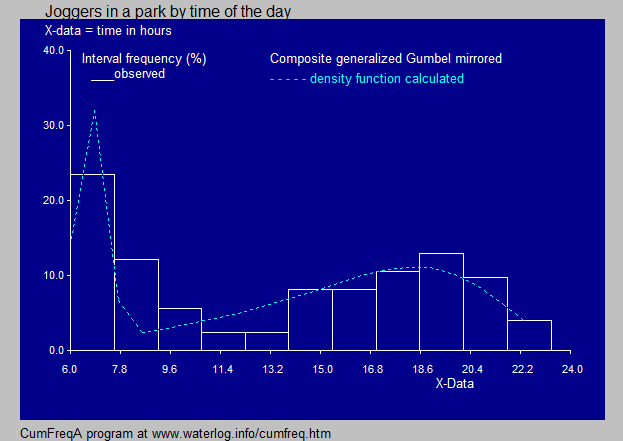
On 6 April 2018, next to the cumulative
distribution function (CDF), the probability
density function (PDF) was inlcluded in the
histogram graph.
Examples are given.
|
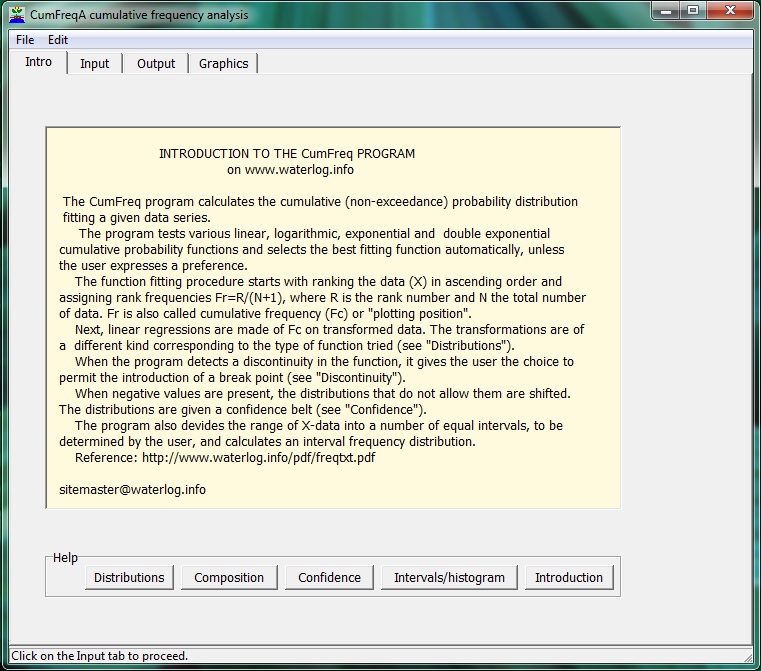
Start:
The program starts clicking on CumFreq.Exe.
More details are given in the program itself.
|
|
Download:
CumFreq
Software
& models
General articles
& manuals
Artículos
(in Spanish,
en Español)
Published
reports & cases
Particular
reports & cases
FAQ's
& answers
Update
record
Home
page
|